Twitter Sentiment Tracker
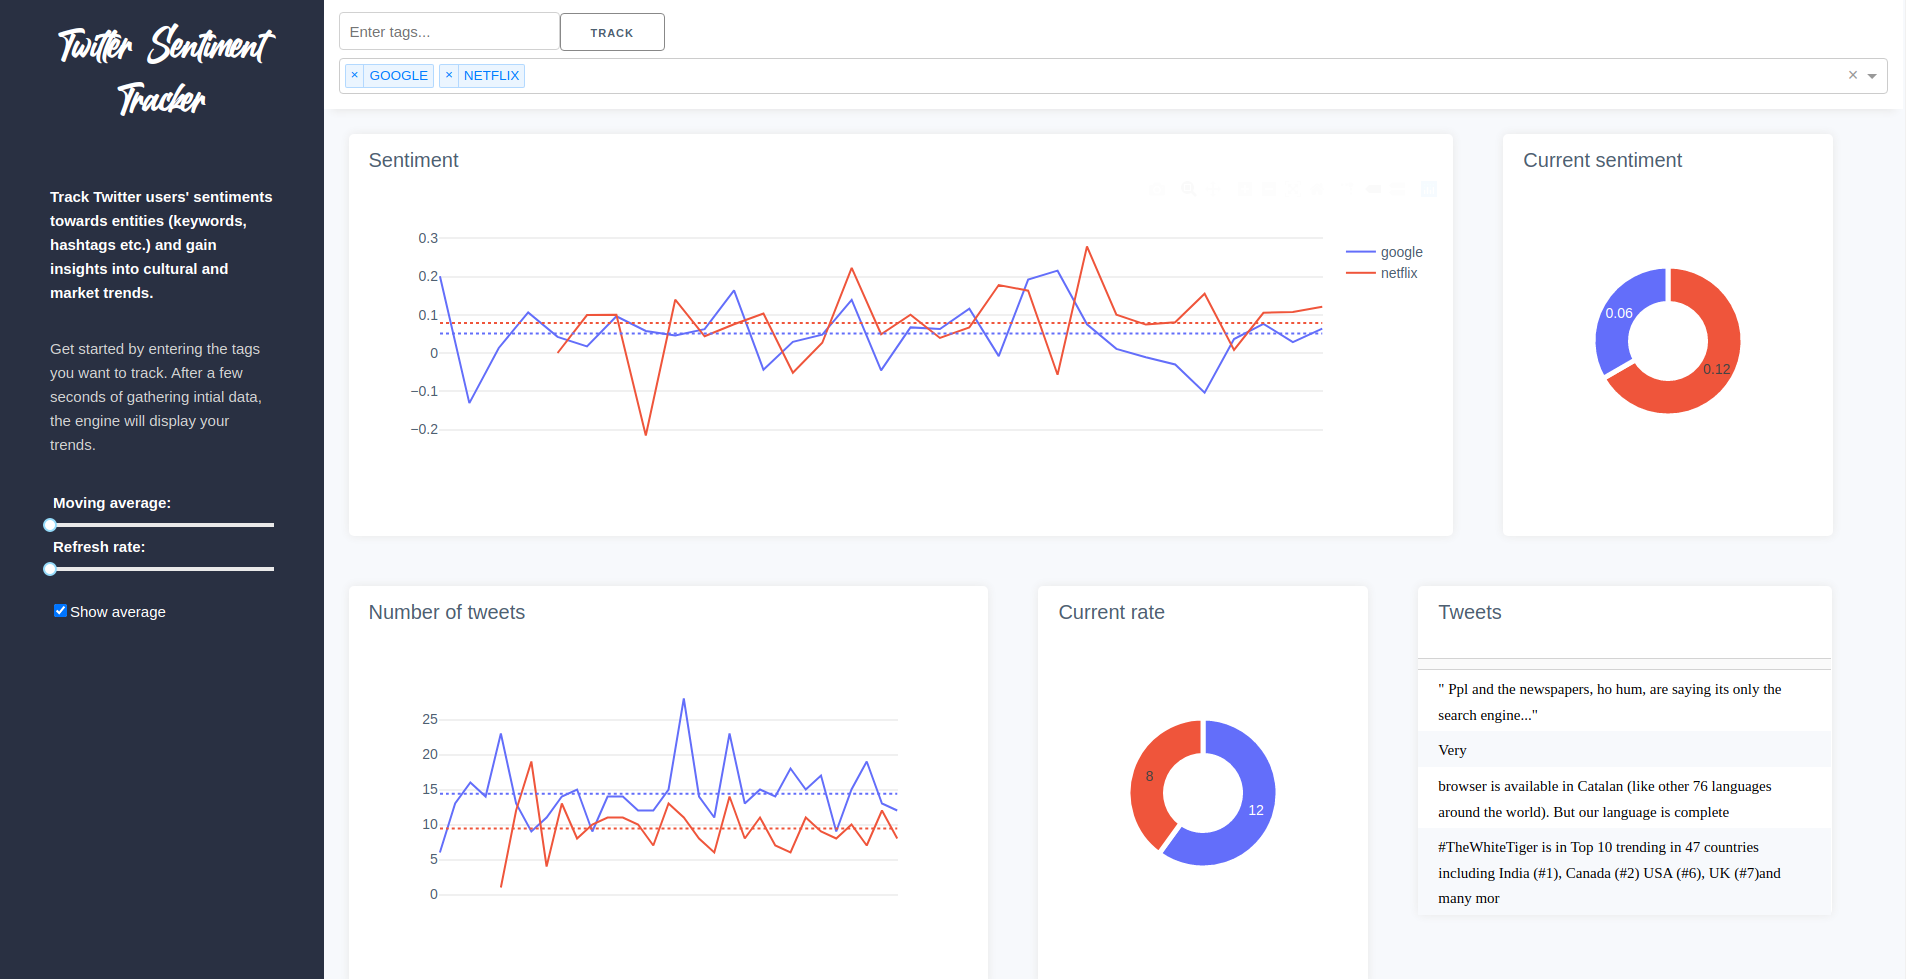
A web-app to discover cultural and market trends by tracking sentiments towards key topics expressed on twitter. The app uses Twitter’s filtered search API along with the textblob python library to extract tweets and analyze users’ sentiments.
ETL pipeline
![]()
The web front-end in the form of a Plotly dashboard is hosted on an Amazon EC2 instance. At the same time, a flask server in charge of administrating active twitter streams is run on a separate EC2 instance. If a new tag is created on the web app, this server will start a corresponding stream which is then sent to and handled by Amazon Kinesis. To ensure scalability to data of high volume and velocity, the stream is ingested on the big data platform Databricks where the ETL workflow is handled by Apache Spark. In the course of this workflow, the following steps are taken:
-
relevant fields such as timestamp and textbody are extracted from the raw data
- a user defined function (UDF) is applied to each tweet to assign a sentiment score. Internally, the UDF utilizes the text processing python library “textblob” which uses a pre-trained naive-bayes model.
-
data is aggregated over a five second time window
- the aggregated data containing the fields: timestamp, average number of tweets, average sentiment as well as sample tweets for every time-window is stored to a AWS S3 bucket in the form of a csv file.
The following Spark query is applied to the input stream
  outDF = (kinesisDF
           .selectExpr("cast(data as string)")
           .withColumn('id', get_json_object(col("data"),"$[0].id"))
           .withColumn('ts', get_json_object(col("data"),"$[0].ts"))
           .withColumn('tweet', get_json_object(col("data"),"$[0].tweet"))
           .withColumn('tag', get_json_object(col("data"),"$[0].tag"))
           .withColumn('sentiment', getSentiment(col("tweet")).cast(FloatType()))
           .withColumn('datetime',
                     to_timestamp(regexp_extract( col('ts'), '\\w\\w\\w \\d\\d? (\\d+):(\\d+):(\\d+)',0),
                                  "MMM dd HH:mm:ss"))
           .select(col('sentiment'),col('datetime'), col('tag'), col('tweet'))
           .withColumn('sentiment_cnt', col("sentiment"))
           .withColumn('tweet_dup', col("tweet"))
           .groupBy(col("tag"), window(col('datetime'), "5 seconds").alias("timewindow"))
           .agg({'sentiment_cnt': 'count','sentiment':'avg','tweet':'first','tweet_dup':'last'})
           .withColumnRenamed("count(sentiment_cnt)","notweets")
           .withColumnRenamed("avg(sentiment)","avgsentiment")
           .withColumnRenamed('first(tweet)',"tweet1")
           .withColumnRenamed('last(tweet_dup)',"tweet2")
           .withColumn('timestamp',col("timewindow").cast("string"))
           .drop(col("timewindow"))
          )
The stored csv file is read periodically (every five seconds) in order to populate the dashboard, creating a live-feed of twitter trends.
Access
Code and instructions to self-host this project can be found here