Political Twitter - Report
Project description
This project served as a capstone for the “Learn SQL for Data Science Specialization” on Coursera. The original task was to create a report for a fictional company named “Lobbyists4America” based on tweets from politicians between the years 2008 and 2017.
As no more details regarding the task were given, I decided that the goal of my project will be to develop a general understanding of the political landscape in the US. I will identify both relationships between politicians and attitudes of politicians towards key topics. Apart from helping voters get a better idea of their politicians’ convicitions, it will support (fictional) lobbyists in determining how to best allocate resources. Trying to get a piece of legislation to pass, the lobbyist can e.g. use this analysis to identify which politicians need to be swayed and which politicians have the largest influence on their colleagues.
Questions
- Basic analysis of tweet statistics: Whose tweets are the most liked, most retweeted? Does the number of tweets correlate with the number of likes and retweets? How does it correlate with the number of followers? Which correlation is stronger?
- Network analysis: What are the relationships between politicians; are they amicable/hostile? What determines these relationships? Are they mostly divided by party line? Which politicians have the largest network, the biggest reach?
- Topic modeling and sentiment analysis: Which topics dominate political twitter? How do members of every party feel/tweet about these topics?
Approach
- To answer question 1.) it will be enough to simply compute summary statistics. To filter out correlations it might be indicative to look at both the total number of likes and the number of likes per tweet (same for number of retweets).
- I will try to define relationships between politicians through mentions, replies and quotes. Sentiment analysis can be used on mentions and replies to establish what kind of relationship two politicians have. For simplicity I will assume that these relationships are undirected (meaning that if A likes B, B likes A). As a metric we can then look at the total number of connections a politician has and further see how many of these connections are negative/positive.
- Topics can both be extracted from the text body of a tweet and hashtags used in the tweet. I will assume that hashtags can be uniquely identified with a topic. Sentiment analysis can then be used to gauge a politicians opinian towards a topic.
Challenges
The main challenge during this analysis was the lack of data regarding party membership as well as office being held by the inviduals behind the twitter accounts. This problem was resolved in a four tier approach:
- The user’s account name as well as account description was parsed for keywords such as “Democratic”, “GOP”, “Senator” etc. This revealed the desired information for about 50% of all accounts.
- Data from the Federal Election Commission (fec.gov) was matched by first and last name to twitter accounts to assign party membership where step 1 failed.
- A python script was created to scrape Wikipedia for information about accounts for which the previous approaches returned no results.
- The remaining approx. 20 accounts were manually scanned and information was retrieved through google searches.
Results
Tweet statistics
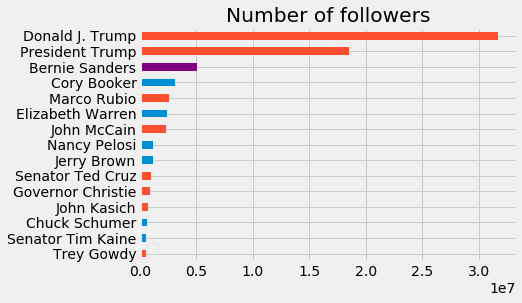
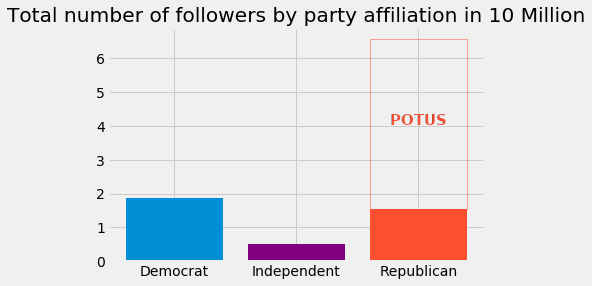
Donald Trump has the largest number of followers; in fact he has more followers than all Democrats and Republicans combined.
Cory Booker leads in number of tweets.
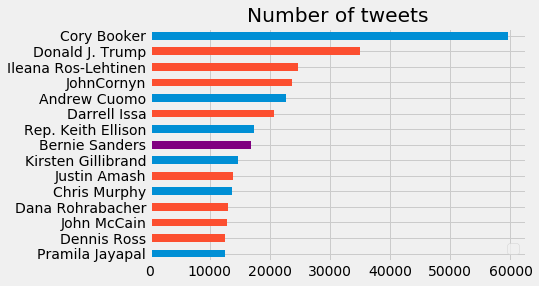
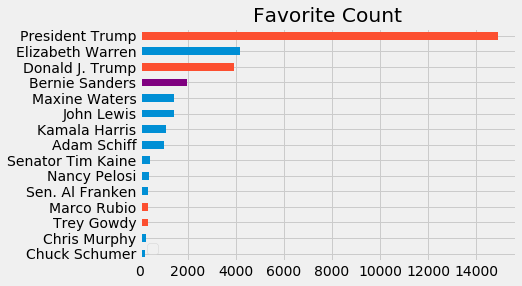
However, in number of likes (aka favorites) per tweet he does not make it to the top 15
Looking at correlations within our data we see that the number of followers is correlated with the number of likes per tweet ($R^2 = 0.57$), however no correlation between number of followers and number of retweets per tweet can be observed ($R^2=0.01$). Using this knowledge we can fit a linear regression model:
\[\left( \frac{\text{Likes}}{\text{Tweet}} \right) = a \cdot \left( \text{Followers} \right) + b\]Using this model we can identify over- and underperfomers. Here are the top and bottom ten performers:
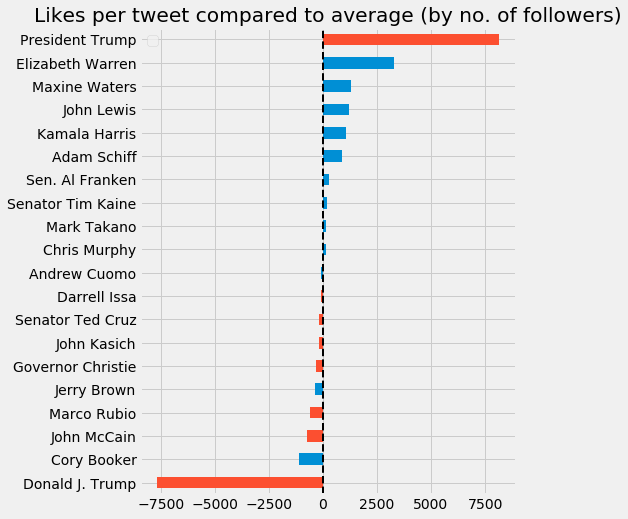
On a party level it seems like Democrats perform better on average than Republicans:
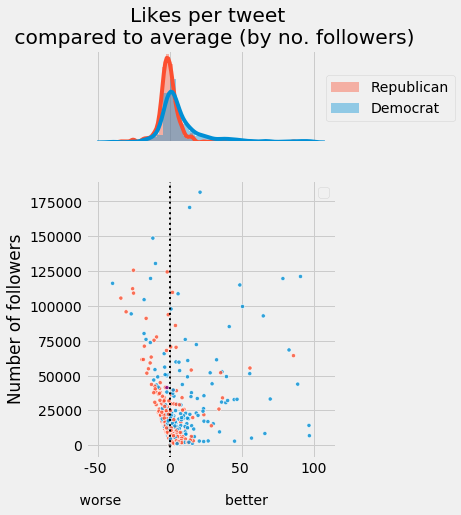
Indeed a two-sample hypotheses test using non-parametric bootstrap reveals that Democrats have on average 10 more likes per tweet as expected by their number of followers ($p < 10^{-5}$, 95% confidence interval: (6,13))
Network analysis
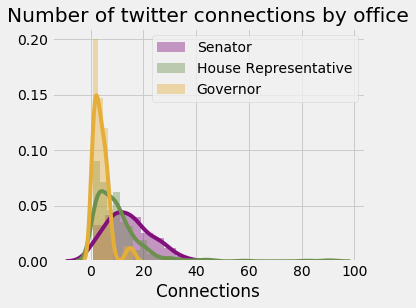
I treated mentions, replies and quotes as (undirected) connections. Senators have on average 4.8 more connections than House Representatives and Governors ($p=7\cdot10^{-4}$, 95% CI: (2.5, 6.9)).
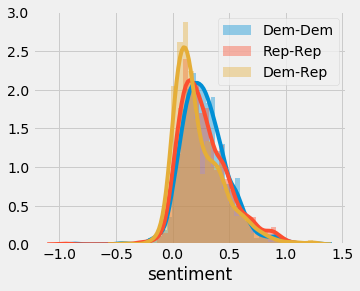
Analyzing the sentiment of these connections (-1: most negative sentiment, +1 most positive sentiment), I find that inner-party relationships are slightly more positive than those across party lines (Average deviation: 0.054 (0.003,0.104), P-value: 0.0412)
From the network graph shown below we can infer several things. Senators (shown with bold borders) seem to cluster, which means that they form stronger networks with other Senators. Using the graph interactively we can identify which politicians communicate more across party lines. These are the ones closer to the boundary between Republicans and Democrats. We can further see that both Bernie Sanders and maybe more surprisingly Donald Trump is surrounded by mostly Democrats.
Topic modeling
For simplicity we only use hashtags to attach a topic to given tweet. Interestingly, only 1% of distinct hashtags make up about 50% of all usages of hashtags in this corpus:

Here is an overview of these hashtags:
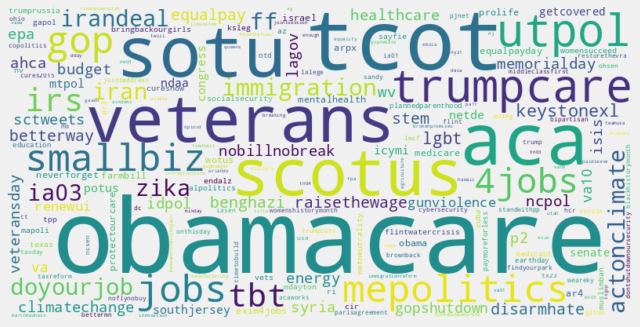
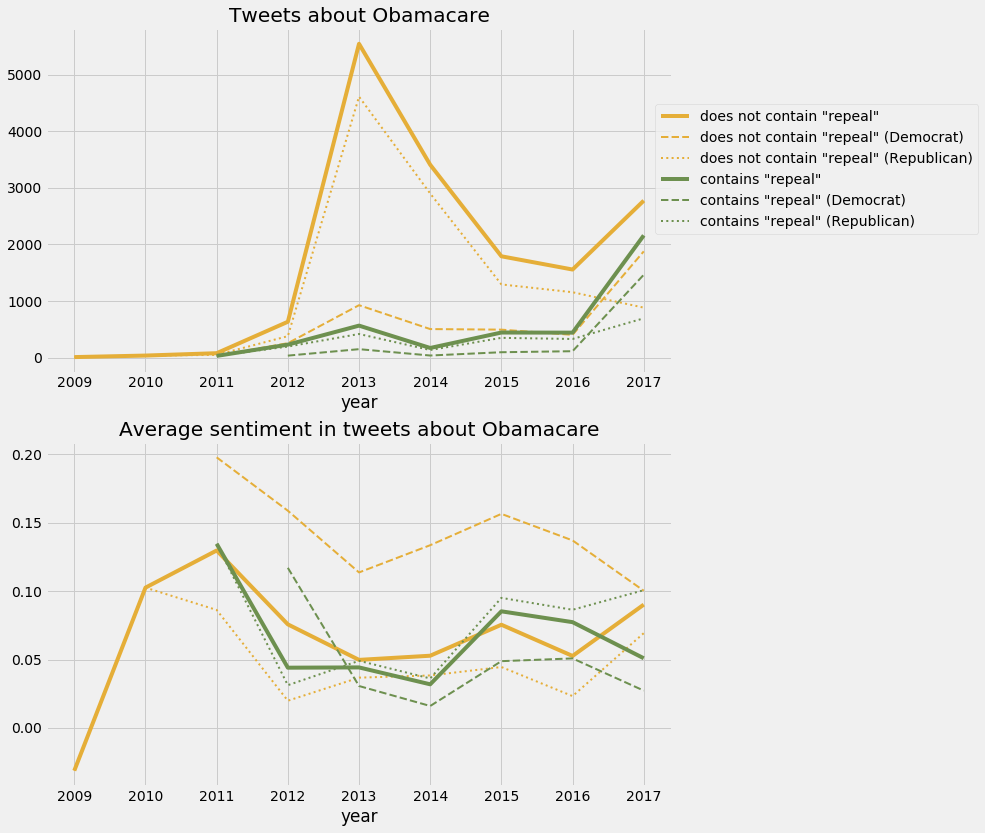
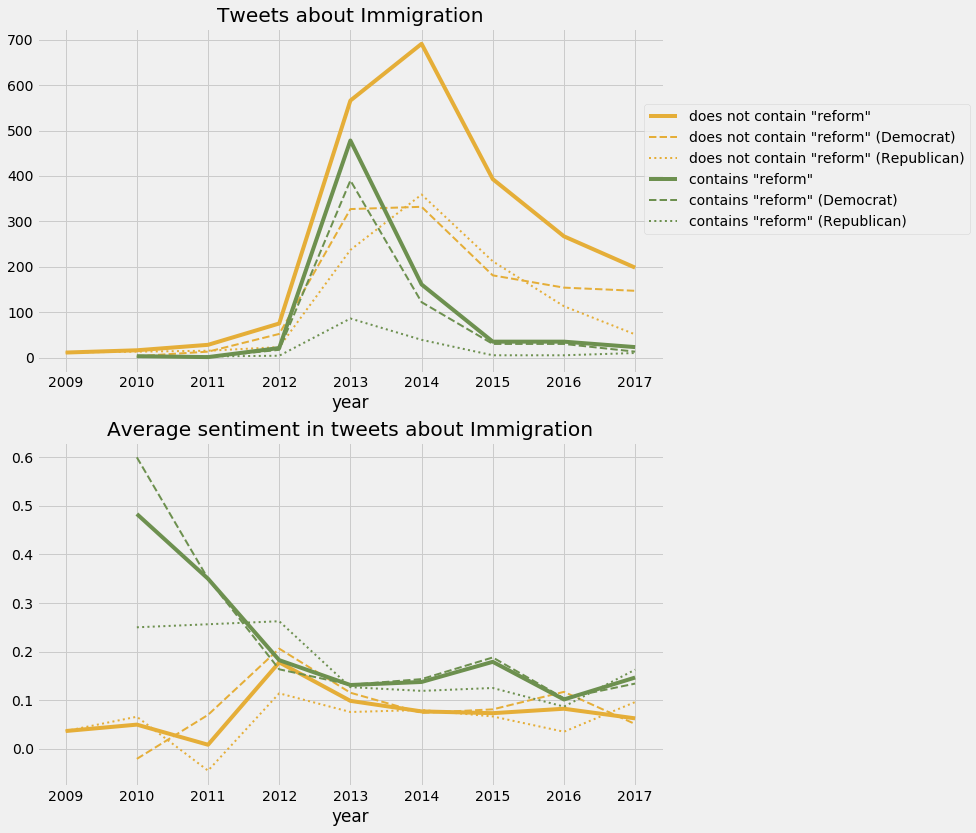
I picked “Obamacare/ACA” and “Immigration” for further analysis. It should be noted that sentiments reported should be taken with a grain of salt, as they gauge the tone of a given tweet and not necessarily the opinion of a politician towards a topic. For example “The best case against #Obamacare is proving to be Obamacare itself” is certainly coming from a politician opposed to the affordable care act but will be counted a having a positive sentiment because of the occurrence of the word “best”. Therefore a more reliable measure may be to simply look about the tweet frequency about a given topic and split by keywords such as “repeal” for Obamacare and “reform” for immigration.
Conclusion
I have identified which politicians have the largest platform, both among their colleagues and their followers. Moving forward, I would recommend Lobbyists4America (the fictional company this report was geared towards) focus on politicians who are both popular among their followers (many followers + more likes per tweet than expected) and have a strong network of fellow politicians. An investment into these key-players should pay off as their opinion towards a policy/topic will quickly propagate. Given the vast number of politicians included in this dataset I have often resorted to presenting only the top and bottom precentiles. In the future it might be helpful to have an interactive dashboard that stakeholders can use to browse/analyze the dataset themselves.